
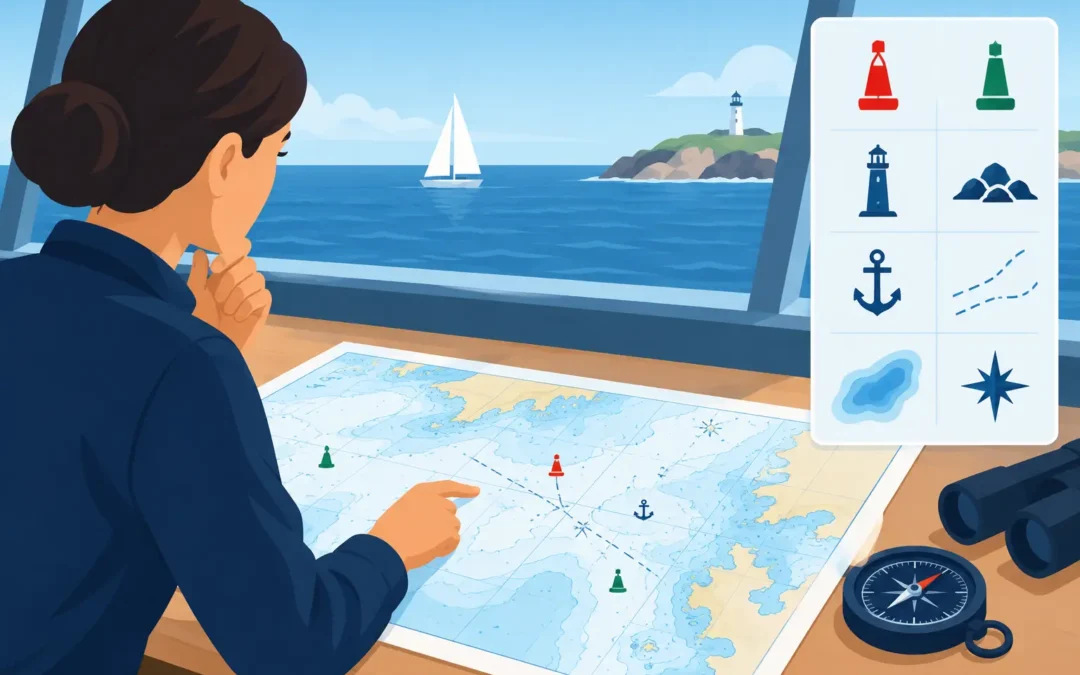
A chart question can sound simple in an AMSA assessment: “What is that symbol?” Under pressure, though, a candidate may identify the buoy but miss the light characteristic, confuse a drying height with a sounding, or fail to explain what the symbol means for a safe passage plan. Knowing how to interpret chart symbols is not about memorising a page of marks. It is about turning the information on the chart into sound decisions on the water.
For Coxswain and Master candidates, chartwork is often tested alongside tides, passage planning, collision regulations and emergency response. The assessor wants to hear that you can recognise a hazard, calculate the available water, select a safe route and verify what you see outside against the chart. That is the standard worth preparing for.
Start With the Chart’s Information Panel
Before reading individual symbols, establish what chart you have in front of you. Check its scale, edition, correction status, chart datum, projection and notes. A chart can be perfectly familiar yet unsuitable for close-quarters work if its scale is too small to show the detail you need.
The title block and marginal information tell you how to treat the data. Soundings on Australian nautical charts are generally referred to chart datum, which is approximately the level that tide is unlikely to fall below. This does not mean the water will always be at the printed depth. You still need to apply the height of tide, consider squat and allow for your vessel’s draught and safety margin.
A useful habit is to say the full chain of reasoning aloud: the charted depth is the depth above chart datum; the predicted tide increases the available depth; then vessel draught, squat and under-keel clearance are deducted. This is the practical interpretation an assessor is looking for, not just a correct number.
How to Interpret Chart Symbols by Category
Do not attempt to learn a chart as a random collection of pictures. Group symbols by what they tell you operationally: depth and seabed, navigation aids, hazards, limits, and services or facilities. Once you know the purpose of a symbol, you are far less likely to freeze when the chart looks busy.
The Australian chart-symbol reference is the appropriate authority when you need to confirm an abbreviation, line style or specialised mark. In an assessment, however, you should first be able to explain the common features that affect safe navigation without hunting through a reference book.
Depths, contours and drying areas
Soundings are the printed depth figures on a chart. Their position matters. A small figure beside a channel edge may be more important than a larger depth in open water because it may control your route, especially at low tide.
Depth contours join areas of similar depth and help you see the shape of the seabed. They can show a channel, bank, shoaling area or a rapid reduction in depth. Do not view contours as decoration. They are early warning signs of where your margin may disappear.
A drying height is shown in green and indicates an area or feature that dries above chart datum. A drying rock or drying bank can be exposed at low water and covered at higher stages of tide. Candidates commonly confuse this with a sounding. The difference is critical: a sounding describes water depth below chart datum, while a drying height describes the height of the feature above it.
When working near a drying area, calculate the height of tide and compare it to the drying height. Then allow for the vessel’s draught. If the calculation only just works, it is not a comfortable operating margin. In real operations, weather, swell, heel, squat and an imperfect position fix can quickly use up that small allowance.
Rocks, wrecks and obstructions
A rock symbol needs more than a quick glance. Determine whether it is awash, submerged, drying, or has a stated depth over it. A wreck may be dangerous to surface navigation, have a known safe clearance, or be marked as foul ground. Read the accompanying abbreviation and sounding rather than assuming all wreck symbols carry the same risk.
Foul ground means the seabed is unsuitable for anchoring or may contain hazards to navigation. It does not automatically mean a vessel cannot pass over it, but it should make you cautious. The exact response depends on the charted depth, your draught, sea state and the purpose of your manoeuvre.
For an oral assessment, practise answering in operational terms. Instead of saying, “That is a wreck,” say, “It is a wreck with a least charted depth of X metres, so I would assess available depth at the time, keep clear where practicable and avoid anchoring in the area.”
Buoys, beacons and lights
Navigation aids are often where chart symbols become most information-dense. A buoy symbol may indicate its type, colour pattern, topmark, light colour, rhythm and nominal range. The chart is telling you both how to identify the mark and how it assists your navigation.
In Australian waters, the IALA Maritime Buoyage System Region A applies. Lateral marks use red to port when entering from seaward, with green to starboard. But do not rely on colour alone. Confirm the direction of buoyage shown on the chart, particularly in rivers, ports and complicated channels. A candidate who understands “entering from seaward” but cannot identify the direction of buoyage on a particular chart has not completed the task.
Cardinal marks indicate where safe water lies in relation to the mark: north, east, south or west. Their black and yellow colour patterns, topmarks and light characteristics help distinguish them. In reduced visibility or at night, the light characteristic may be the feature that confirms your identification.
Read light descriptions carefully. A notation such as Fl.R.3s tells you the light flashes red every three seconds. A group flashing light, occulting light or quick-flashing cardinal light carries different information. The stated range is also not a promise that you will see it from that distance. Background lighting, rain, haze, the height of eye and the height of the light all affect visibility.
Leading lines, sectors and transits
Leading lines and transit marks give you a visual method of holding a safe track. When the front and rear marks are in line, you are on the intended leading line. This can be particularly valuable in a narrow channel, but it does not remove the need to monitor position, depth and traffic.
Light sectors are shown as coloured arcs or bearings around a lighthouse or beacon. A white sector may indicate a safe approach, while red or green sectors can warn that you are outside the preferred channel or nearing danger. Always check the sector bearings and the charted note. A sector boundary is not a line to run along. Give it a sensible margin.
Restricted areas and charted limits
Lines and tints can represent traffic separation schemes, harbour limits, anchorages, prohibited areas, submarine cables, marine farms, restricted zones and pilotage areas. The line style matters, as does any label printed beside it.
A charted cable area is a good example of why symbols must lead to action. The symbol does not necessarily prohibit passage, but it tells you not to anchor, trawl or conduct an activity that could damage the cable. An anchorage symbol may show where anchoring is suitable, but you still need to consider swing room, depth, holding, weather and local requirements.
Read the Whole Picture, Not One Symbol
The most common chartwork mistake is treating symbols in isolation. A safe route comes from combining them. A channel may have adequate depths at high water, but a nearby lateral mark could be unlit, the turn may be constrained by a drying bank, and a sector light may indicate the safer approach.
Build a simple routine whenever you examine a section of chart. Identify the intended track, then look for controlling depths, hazards either side of track, navigation aids, tidal constraints and any operating limits. Finally, consider how you will verify the plan on the vessel using visual marks, electronic navigation, sounder readings and proper lookout.
Electronic chart displays help, but they can also hide detail through scale settings, layers or safety-depth filters. Zooming in is useful, but it is not a substitute for checking the underlying chart information and notices. A competent skipper understands what the display is showing, what it may be filtering out, and when a paper chart or official reference needs to be consulted.
Prepare for the Assessment With Practical Questions
Assessment preparation works best when you practise the questions behind the symbol. Ask yourself: What is it? What does it mean? What risk does it present? What would I do next? That approach develops the explanation skills required in a face-to-face oral assessment.
Use real chart extracts and cover the answers before identifying marks. Then add the tide calculation, your vessel draught and a proposed track. If you are unsure, do not simply memorise the correct response. Find out why the symbol is drawn that way and what it changes in a real passage plan.
At True North Marine Training, individual revision can focus on the symbols and chartwork questions that are causing trouble, whether that is buoyage, lights, tides, plotting or safe under-keel clearance. Targeted practice is usually more productive than trying to revise every subject equally the night before an assessment.
The goal is not to recite every mark on a chart. It is to look at a charted feature, understand its meaning, and make the safe professional decision before it becomes urgent.