
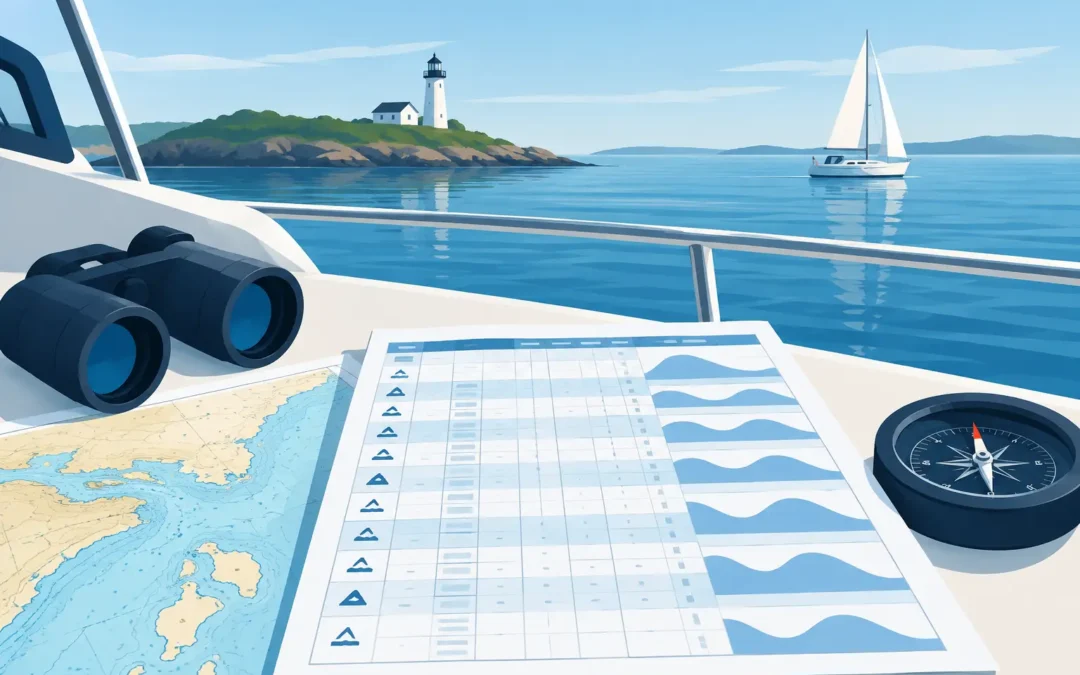
A tide table can look straightforward until you need to decide whether there is enough water to cross a shallow bar, enter a marina, or pass over a charted shoal. Knowing how to read tide tables is not just a navigation exercise. For a Coxswain or Master candidate, it is practical safety knowledge that an assessor may expect you to explain clearly and apply to a real voyage.
The key is to treat the published prediction as one part of your passage plan, not a guarantee of conditions on the water. Tide height, tidal stream, weather, swell, vessel draught and chart datum all need to work together before you commit to a shallow-water transit.
Start with the port, date and time zone
First, confirm that you are looking at the correct location and date. Tide tables are prepared for a particular place, usually a standard port or a secondary port. A standard port has predicted times and heights published directly. A secondary port uses corrections based on a nearby standard port.
Do not assume the closest named port will produce the same tide at your location. In estuaries, rivers, large bays and complex coastal areas, the difference in time and height can be significant. A high tide at the harbour entrance may arrive later upstream, and the range may be smaller or larger depending on the local geography.
Check the time basis printed in the table or publication. Australian tide information may use local standard time, while daylight saving can create an easy one-hour error in the states where it applies. If you are planning an early-morning departure or a bar crossing with a narrow window, one hour matters.
Understand what each tide table entry means
A basic tide table lists the times and predicted heights of high water and low water. The height is normally shown in metres. High water is the predicted peak of the tide. Low water is the predicted lowest point before it rises again.
A typical day may show two high waters and two low waters, but not every location behaves exactly that way. Some ports have irregular patterns, unequal highs and lows, or a predominantly single daily tide. Read the actual entries rather than relying on a rule that every tide will occur roughly six hours apart.
For example, a table might show:
| Time | Tide | Predicted height | |—|—:|—:| | 0215 | Low water | 0.4 m | | 0835 | High water | 2.8 m | | 1445 | Low water | 0.6 m | | 2105 | High water | 3.0 m |
This tells you that at 0835 the predicted height of tide is 2.8 metres above chart datum. It does not mean the water depth everywhere is 2.8 metres. To find the expected depth at a charted location, you add the height of tide to the charted depth, provided both are referenced correctly.
Chart datum is the reference that matters
On Australian nautical charts, soundings are generally reduced to chart datum, which is a low-water reference level. A charted depth of 1.2 metres means there should be at least 1.2 metres of water at chart datum, not at average sea level and not at the time the survey was made.
If the tide height is predicted to be 2.3 metres, the simple calculation is:
Charted depth + height of tide = predicted water depth
So, for a charted depth of 1.2 metres:
1.2 m + 2.3 m = 3.5 m predicted depth
That calculation is useful, but it is only the starting point. You still need to allow for your vessel’s draught, squat when underway, heel, sea state, survey limitations and a sensible under-keel clearance. A vessel with a 2.8-metre draught does not have a comfortable margin in 3.5 metres of predicted water, particularly in a channel affected by swell or traffic wash.
For assessment preparation, be ready to explain chart datum in plain language. Assessors are often looking for evidence that you understand what a charted sounding represents and that you will not confuse tide height with actual available depth.
Finding the height between high and low water
Tide tables give heights at high and low water, but your transit may be planned for 1030, 1245 or another time in between. You need to estimate the height of tide at that time using the method required by your operational procedure, publication or assessment.
The rule of twelfths is commonly taught as a quick approximation for a roughly regular tide. It assumes the tidal range changes in twelfths over six equal periods: 1, 2, 3, 3, 2 and 1 twelfths of the range. It is helpful for building an understanding of tidal movement, but it is not reliable enough to replace proper tidal curve information where accuracy is critical.
Take a rising tide from 0.5 metres at low water to 2.9 metres at high water. The range is 2.4 metres. After three hours, the rule of twelfths estimates that 6/12 of the range has risen:
2.4 m × 6/12 = 1.2 m
Add that rise to the low-water height:
0.5 m + 1.2 m = 1.7 m
If you need to cross a drying bank, work from the official tide curve or approved tidal information wherever possible. Local tide behaviour, wind setup and atmospheric pressure can make a rough calculation inadequate.
Apply secondary-port corrections carefully
If your destination is a secondary port, the tide table may provide a time correction and a height correction relative to a standard port. Read the correction notes carefully. A time correction may be added or subtracted, while a height adjustment may be a fixed amount, a ratio, or a calculation applied to the standard-port range.
This is an area where candidates can lose marks by rushing. Write each step down, identify whether the correction applies to high water, low water or both, and confirm that the result makes practical sense. If the corrected high water occurs before the standard-port high water, that may be entirely normal. The tide does not reach every point on the coast at the same time.
Tide height is not tidal stream
A tide table tells you the vertical movement of the water. It does not necessarily tell you the direction and rate of horizontal water movement. For that, you need tidal stream information, local knowledge, current predictions or the relevant chart and publication.
This distinction is particularly important around headlands, river entrances, narrow channels and bar crossings. You may have enough depth for the vessel, yet still face an unsafe situation if an ebb current is running against a strong onshore swell. Conversely, a flood tide may improve depth but produce a current that affects your handling, speed over the ground and manoeuvring room.
When planning, ask practical questions: Will the tide be rising or falling during the transit? What will the current be doing? If the engine loses power or the vessel is delayed, do you still have a safe margin? Those are operational questions, not just calculation questions.
Build a margin into every shallow-water decision
A good tide calculation should leave room for uncertainty. Predicted tide heights are based on astronomical forces. Actual levels can be altered by wind, pressure, rainfall, river flow and swell. Strong onshore winds can raise water levels, while offshore winds may lower them. A low-pressure system can also increase sea level, but no skipper should use a favourable weather effect as a planned safety allowance.
Your under-keel clearance policy should suit the vessel, the bottom type, the accuracy of available information and the consequences of touching bottom. A soft mud berth may call for a different operational decision from a rocky passage with breaking swell, but both require a deliberate margin.
Before departure, compare your planned tidal window with the latest weather forecast, notices and local conditions. Once underway, use the depth sounder, visual marks and your position monitoring to confirm that the situation matches the plan. If it does not, slow down, reassess or turn around. Pressing on because the table looked favourable earlier is not sound seamanship.
Be ready to explain your working
In an oral assessment, you may be given a chart, a tide table and a vessel draught, then asked whether a passage is safe at a nominated time. Show your method. Identify the charted depth, state the predicted tide height, calculate available water, subtract draught and explain the under-keel clearance you would retain.
Clear working shows more than mathematical ability. It shows that you can make a defensible decision when operating commercially, supervising crew or carrying passengers. If the calculation is unfamiliar after time away from study, targeted question-based revision can quickly rebuild that confidence.
Tide tables reward careful habits. Read the location, check the time basis, understand the datum, calculate the available depth and leave a margin that reflects the conditions. Get those habits right on paper, and they will serve you well when the water is moving beneath the keel.